
A liquidity trap in crypto is a deliberate price move into clustered stop orders, engineered to fill size before the market reverses. The immediate takeaway: never chase a wick beyond a level. Wait for the candle to close back inside the range, confirm with volume and CVD, then act. Snipethem's traders lean on this rule constantly because the alternative is getting stopped out on the exact move that should have been your entry.
TL;DR:
- Liquidity traps are formed by deliberate stop-clustering near predictable levels like equal highs, round numbers, and liquidation zones, often amplified by leverage.
- Spotting a liquidity sweep requires waiting for a wick beyond a level, followed by a close back inside the range and confirmation with volume and CVD divergence.
- Volume and order book signals are most reliable when confirmed together, but false positives increase during volatile or thin market conditions.
- Reaction speed is critical; tools like Snipethem enable traders to mirror top traders' entries instantly, giving an edge in fast-moving sweep scenarios.
- Managing risk involves sizing for worst-case slippage, placing stops beyond the wick with a buffer, and avoiding impulsive entries based solely on wick movements.
Table of Contents
- How Liquidity Traps Form in Crypto: The Mechanics
- Buy-Side vs. Sell-Side Sweeps: What the Signals Actually Look Like
- How to Spot a Liquidity Sweep in Real Time
- Fade the Sweep or Trade the Breakout: Rules and Common Mistakes
- Risk Management for Liquidity Events in Crypto
- How Snipethem Helps Traders Detect and React to Sweeps
- The Psychological Toll of Trading Around Liquidity Traps
- Notable Liquidity Sweep Events in Major Cryptocurrencies
- Crypto Liquidity Traps vs. Traditional Market Stop Hunts
- Algorithmic Trading's Role in Sweep Formation
- Where Sweep Detection Methods Fall Short
- Volatility Spikes and Shifting Market Structure
- Quick Reference: Tools for Charting, CVD, and Liquidation Data
- A Pragmatic Take on Trading Liquidity Sweeps
- Trade Sweeps Faster With Snipethem
- Sources
How Liquidity Traps Form in Crypto: The Mechanics
Liquidity traps don't form randomly. They cluster wherever traders park predictable orders, and price naturally gravitates toward those pockets because market makers and larger players need volume to fill their own positions. Stop-loss orders create predictable liquidity pockets, and stop-loss hunting happens when price gets pushed directly into those areas, triggering the stops before reversing.
Retail traders make this easy by placing stops in the same handful of spots:
- Equal highs and equal lows, where multiple failed breakout attempts leave stacked orders
- Previous day's high and low (PDH/PDL), watched by nearly every intraday trader
- Round numbers like $65,000 or $3,000, which act as psychological magnets
- Liquidation clusters visible on leverage-heavy pairs, where cascading margin calls amplify the move
Crypto amplifies this dynamic because order books are thinner than in equities or forex, and perpetual futures markets run on leverage ratios that traditional markets rarely allow. A sweep into a liquidation cluster doesn't just fill a few limit orders. It triggers a cascade of forced liquidations that accelerates the very move that started it. The critical distinction is between a sweep, which rejects the level and reverses, and a breakout, which accepts the level and continues. Confusing the two is how most losing trades happen.
Buy-Side vs. Sell-Side Sweeps: What the Signals Actually Look Like
A sell-side sweep pushes price below a support level, often an equal low or PDL, to trigger resting sell stops before buyers step back in and reverse it upward. A buy-side sweep does the opposite: price spikes above resistance, clips breakout buy stops, then falls back below the level. Both share the same signature.
A liquidity grab is a push beyond an obvious level to trigger clustered orders, and the core tell is a wick beyond the level with a body that closes back inside the prior range. That single visual, wick out, body back in, is the most reliable piece of evidence you'll get in real time.
Four signals confirm it:
- Wick beyond, close inside: the level gets tagged, but the candle body settles back inside the range
- Volume spike then fade: a burst of volume on the sweep candle followed by immediate contraction
- CVD divergence: price makes a new high or low while cumulative volume delta fails to confirm it, showing absorption rather than genuine demand
- Order-book thinning: rapid bid or ask removal and widening spreads right at the level
Statistic Callout: CVD divergence paired with a volume spike on the sweep wick, followed by reversal and a change of character within one to three candles, reliably separates genuine sweeps from real breakouts across many crypto setups.
How to Spot a Liquidity Sweep in Real Time
Spotting a sweep before it burns your position comes down to sequence. Skip a step and you're guessing.
- Mark your levels before the session starts. Identify equal highs and lows, PDH/PDL, and round numbers on your chart. Do this in advance, not while price is already moving.
- Watch for the wick. When price pokes beyond a marked level, don't react yet. That poke alone tells you nothing.
- Wait for the candle to close back inside the range. This close-back-inside is your first real piece of evidence.
- Confirm with volume and CVD. A practical framework marks equal highs and lows, waits for the close-back-inside, and requires volume and structure confirmation before treating the move as valid. Check a liquidation heatmap to see whether the sweep cleared a known cluster.
- Enter on the trigger. A change of character (CHoCH) on a lower timeframe, or a retest of the reclaimed level, is your entry signal.
- Set your stop beyond the sweep wick, with a small buffer for noise, and target the opposite liquidity pool.
Pro Tip: Session timing matters more than most traders admit. Sweeps during thin Asian-session hours produce more false signals than those during London or New York overlap, simply because there's less real volume to confirm the move.
Fade the Sweep or Trade the Breakout: Rules and Common Mistakes
Once you've confirmed a sweep, you have two tactical paths, and picking the wrong one is where most accounts bleed out.
Fade the sweep when you see the full signature: wick beyond the level, close back inside, volume spike fading, and CVD divergence. This works best when your higher-timeframe bias already favors a reversal at that level. Entry comes on the CHoCH, stop goes just beyond the sweep wick, and your target is the nearest opposite liquidity pool. Risk-reward on a clean fade often runs 1:2 or better because your stop sits tight against the wick.
Follow the breakout when price accepts beyond the level instead of rejecting it, volume expands rather than fades, and CVD moves in agreement with price. Entry comes on a retest of the broken level, stop sits below the retest low, and targets extend to the next major structure point.
| Mistake | Why it hurts | Fix |
|---|---|---|
| Chasing the wick | You enter before confirmation, right where the trap wants you | Wait for the close and one added signal |
| Stops in obvious spots | You become the next liquidity pool | Place stops beyond structure, with a buffer |
| Ignoring slippage | Thin books turn a good stop into a bad fill | Size for worst-case fill, not the quoted price |
- Never enter on the wick alone; the wick is bait, not confirmation.
- Never place your stop exactly at the prior high or low; that's where everyone else's stop sits too.
Risk Management for Liquidity Events in Crypto
Surviving a sweep is a sizing problem before it's a signal problem. Crypto's thin liquidity and common leverage use make stop hunts more damaging than in deeper, more regulated markets, and the fix is discipline rather than avoidance.
- Size positions assuming your stop fills at the worst reasonable price, not the level you set it at.
- Use limit orders in thin books when possible, and accept that market orders during a sweep can slip several ticks or more.
- Place stops beyond the sweep wick with a real buffer, never at the exact level everyone else is watching.
- Keep leverage modest and check liquidation heatmaps before entering, so you know where the next cluster sits.
- Backtest your setup on a small size before committing real risk to it live.
Understanding slippage and price impact in thin order books changes how you place every order during a volatility spike, not just your stop.
How Snipethem Helps Traders Detect and React to Sweeps
Reaction speed decides whether a sweep costs you or pays you. Snipethem's platform reports very fast response times and high success rates as core capabilities for reacting when a sweep triggers and reverses within seconds.
- Real-time mirroring lets you replicate a top trader's entry the instant they act, cutting the lag between confirmation and execution.
- Live market analytics and liquidation-style views help flag where a sweep is likely to originate before it happens.
- Trader rankings and statistics let you judge whose historical execution style fits sweep-based setups versus breakout continuation.
...
Pro Tip: Paper trade the checklist for a week before deploying it live. Backtest against your own trade history, then consider limited live size only after you can identify five consecutive sweeps correctly on a chart with no hindsight bias.
Reviewing real-time trade mirroring mechanics helps clarify exactly how much reaction lag gets removed once you're following a trader instead of watching the chart alone.
The Psychological Toll of Trading Around Liquidity Traps
Getting stopped out right before a reversal doesn't just cost money. It erodes conviction in a way that compounds over a trading session. A trader swept twice in one day tends to either freeze on the next legitimate setup or overcorrect by widening stops so far that a real invalidation stops meaning anything.
Sentiment across the broader market shifts the same way individual traders do. A visible sweep on a major pair, especially one that clears a large liquidation cluster, often triggers a short burst of panic selling or euphoric buying among traders watching the same chart. That crowd reaction is part of why the reversal after a sweep tends to be sharp rather than gradual. The people who got stopped out are now watching from the sidelines, and the people who anticipated the sweep are buying or selling into their exit.
There's a subtler effect too. Traders who repeatedly get caught in sweeps start distrusting every breakout, including the real ones. That hesitation means they miss genuine continuation moves because they've been conditioned to expect a trap. The opposite failure mode also shows up: traders who fade every wick regardless of confirmation, treating the fade tactic as a reflex instead of a rule-based decision. Both failure modes trace back to the same root cause, which is trading the wick instead of the close.
The healthiest response is procedural rather than emotional. Traders who write down their level marks and confirmation criteria before the session starts make fewer impulsive decisions when a sweep actually happens, because the decision was already made in advance.
Notable Liquidity Sweep Events in Major Cryptocurrencies
Bitcoin's history offers a clean case study almost every cycle. During periods of extreme volatility, price has repeatedly spiked below a widely watched support level, such as a prior monthly low, only to reverse within hours once leveraged short positions got liquidated. The pattern shows up so often on Bitcoin's higher timeframes that traders now mark those liquidation-heavy zones as a matter of routine before major macro events.
Ethereum has shown similar behavior around psychologically significant round numbers, where a sweep below a level like $1,500 or above $3,000 triggered a wave of forced liquidations before price snapped back in the opposite direction within the same trading session.
Smaller-cap tokens and meme coins on networks like Solana show an even more extreme version of the same mechanic, because their order books are thinner and their price action is driven heavily by leveraged retail positioning rather than institutional flow. A single large wallet can sweep a token's recent low, trigger a cluster of retail stops, and reverse the token upward within minutes, a sequence that plays out repeatedly across Pump.fun-style launches where liquidity depth is shallow by design.
What connects these cases isn't the specific price level. It's the presence of a crowded, obvious technical point combined with leveraged positioning nearby. Wherever those two conditions overlap, in any coin, at any market cap, a sweep becomes statistically more likely than a clean breakout.
Crypto Liquidity Traps vs. Traditional Market Stop Hunts
Stop hunts exist in every leveraged market, including forex and equity futures, but crypto's version tends to be more violent for a few structural reasons. Traditional markets generally carry deeper order books, tighter spreads, and regulatory limits on leverage that cap how explosive a liquidation cascade can get.
Crypto exchanges, particularly for perpetual futures on mid-cap and small-cap tokens, often allow leverage far beyond what a retail forex or equities account could access. Crypto's uneven liquidity, common leverage use, and emotional positioning around obvious levels make stop hunts a structural feature of the market rather than an occasional anomaly.
There's also a market-hours difference. Traditional markets close, which gives liquidity time to reset and reduces the odds of a thin-book sweep happening outside normal trading windows. Crypto trades continuously, so a sweep can occur at 3 a.m. in any time zone, when order books are naturally thinner and fewer active participants are around to absorb the move.
A related mechanic worth noting: prediction markets and other event-driven instruments carry their own version of this risk. Thin order books and falling activity as an event nears resolution increase exit-liquidity risk in ways that resemble crypto's sweep dynamics, even though the underlying mechanism differs. Anyone trading illiquid, event-driven crypto derivatives should watch for the same thinning-book warning signs.
Algorithmic Trading's Role in Sweep Formation
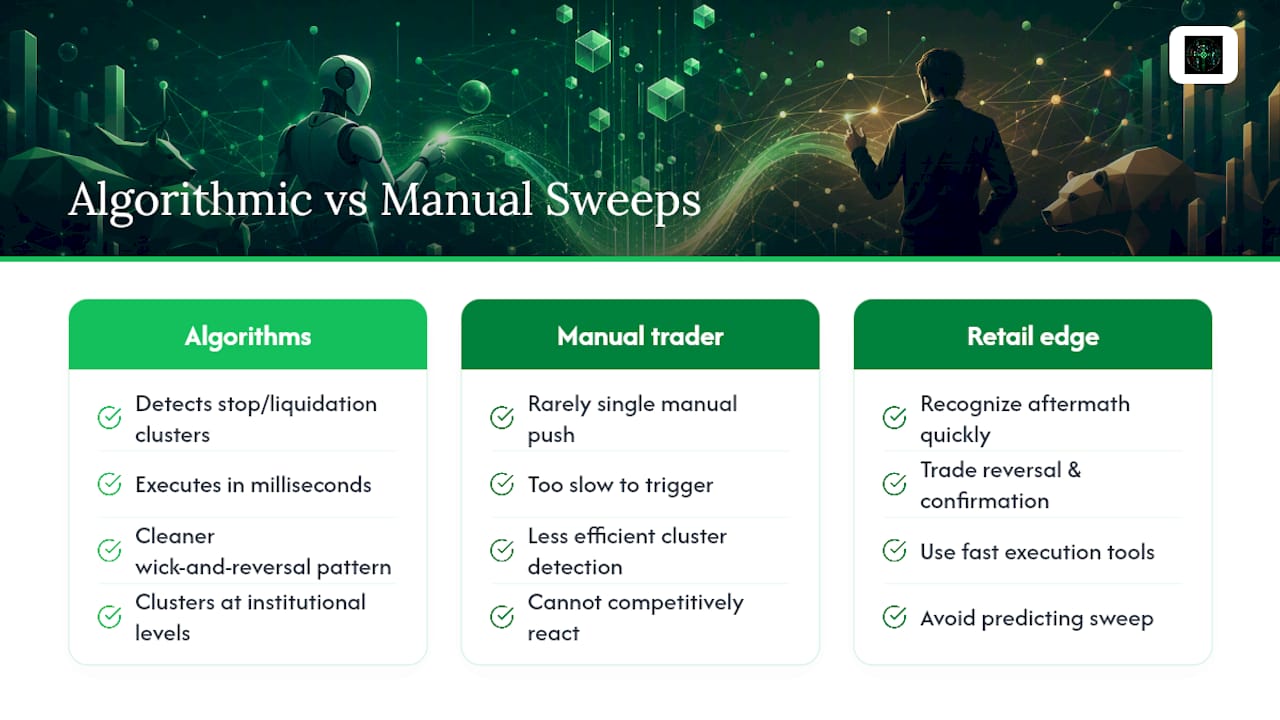
Most liquidity sweeps today aren't the work of a single trader manually pushing price into a level. They're executed by algorithms designed specifically to detect where stop clusters and liquidation pools sit, then route orders to trigger them efficiently.
High-frequency trading systems scan order-book depth continuously, looking for exactly the kind of predictable clustering that retail traders create by placing stops at equal highs, equal lows, and round numbers. Once an algorithm identifies a cluster large enough to justify the cost of the move, it can execute the sweep in milliseconds, well before a human trader could react to the initial wick.
This has changed the character of sweeps in a measurable way. They happen faster, they often show cleaner wick-and-reversal patterns because the algorithm exits the position the instant it fills against the triggered stops, and they cluster more heavily around known institutional levels because that's where algorithmic detection is most efficient. The technical signature a trader looks for, wick beyond, close back inside, volume spike, CVD divergence, exists partly because that's the literal footprint an algorithm leaves when it executes this strategy at scale.
The practical implication for retail traders is that manual reaction time is no longer competitive against the initial trigger. The edge instead lies in recognizing the aftermath quickly, the reversal and confirmation that follow the algorithmic sweep, and positioning for that second phase rather than trying to predict or front-run the sweep itself. This is exactly the phase where fast execution tools matter most.
Where Sweep Detection Methods Fall Short
No detection method here is foolproof, and traders who treat any single signal as guaranteed confirmation will eventually get burned by a false positive. Wick-plus-close-back-inside is the strongest single tell available, but a genuine breakout can occasionally produce a similar-looking wick before continuing, especially during high-volatility news events where price simply overshoots before consolidating and resuming its original direction.
CVD divergence carries its own limitation. It requires reliable, aggregated volume data, and on lower-liquidity tokens or across fragmented exchanges, that data can be noisy enough to produce false divergence signals. A trader relying on CVD from a single thin exchange might see a divergence that doesn't reflect the broader market's actual order flow.
Liquidation heatmaps, useful as they are for spotting where clusters sit, are also a lagging and probabilistic tool rather than a precise map. They estimate likely liquidation zones based on open interest and funding data, but they can't account for hidden limit orders, over-the-counter positioning, or last-minute adjustments traders make to their own stops.
Volume spikes can also mislead during genuinely high-conviction news events, where a real breakout produces a volume surge that looks structurally identical to a sweep's initial burst. The only real defense against these false positives is requiring multiple confirming signals rather than trading off any single one, and accepting that even a well-confirmed setup will occasionally fail. Structure and confirmation reduce error rate; they don't eliminate it.
Volatility Spikes and Shifting Market Structure
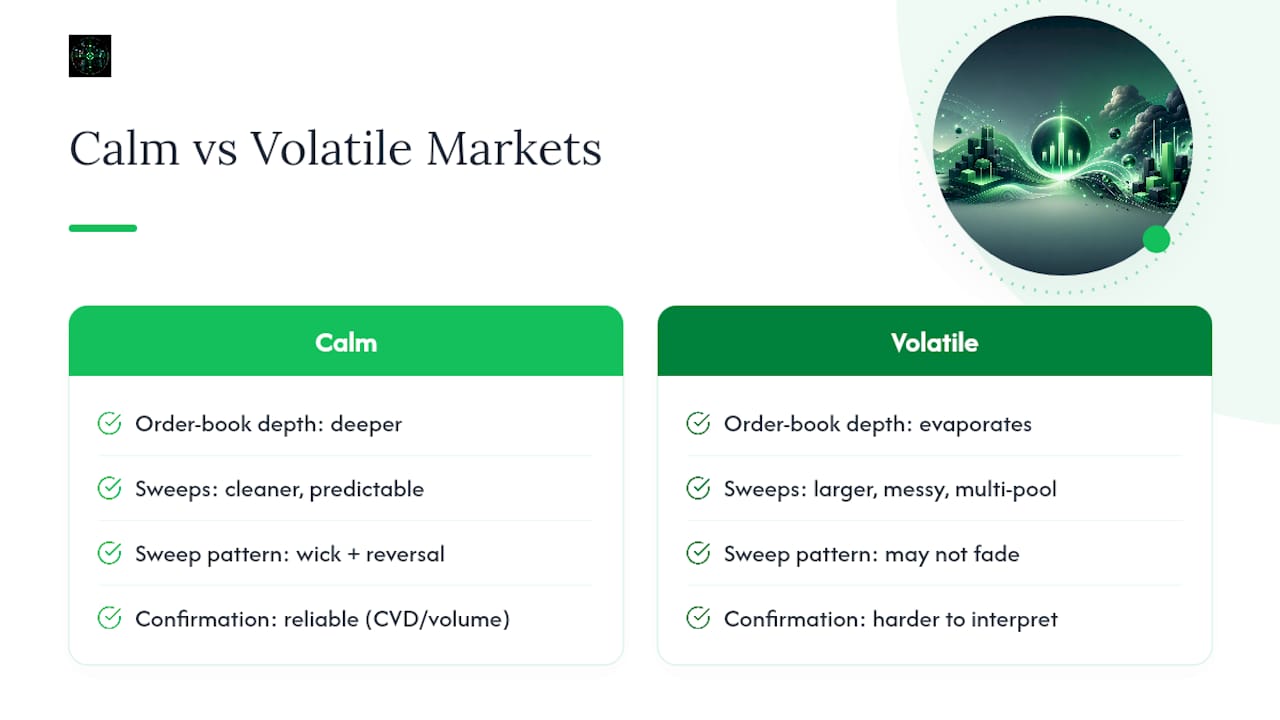
Market structure isn't static, and liquidity traps behave differently depending on how stable or chaotic conditions are at the moment. During calm, range-bound periods, sweeps tend to be cleaner and more predictable because order books are deeper relative to the size of any single move, and the wick-plus-reversal pattern plays out with less noise.
Volatility spikes change this dynamic substantially. When a major news event or macro catalyst hits, order-book depth can evaporate within seconds as market makers pull quotes to avoid getting caught on the wrong side of a fast move. That thinning creates the exact conditions for larger, messier sweeps, ones that can blow through multiple stacked liquidity pools in a single move rather than tagging one clean level and reversing.
This also affects how reliable your confirmation signals are. CVD readings and volume comparisons that work well in calm conditions become harder to interpret when volume across the entire market is elevated, not just at the specific level you're watching. A sweep during a volatility spike might not show the same clean fade-after-spike pattern, because elevated volume is the market's new baseline rather than a standalone confirmation signal.
The practical adjustment during these periods is to widen your confirmation window and reduce position size, rather than trading the same setup with the same conviction you'd use in calmer conditions. Structure that held for weeks can break down in minutes once a volatility spike hits, and the levels that mattered yesterday may simply get run over today, without the orderly reversal that normally follows a sweep.
Quick Reference: Tools for Charting, CVD, and Liquidation Data
For charting and marking levels, TradingView remains the standard for spotting equal highs, lows, and CHoCH structure. For volume-based confirmation, look for CVD indicators built into your exchange's native charting or third-party overlays. For liquidation clustering, dedicated heatmap tools show where leveraged positions concentrate before a sweep occurs.
A Pragmatic Take on Trading Liquidity Sweeps
Most losing trades around sweeps aren't caused by bad analysis. They're caused by impatience, entering on the wick because waiting for the close feels like missing the move. It doesn't. The reversal after a real sweep almost always leaves room to enter on confirmation.
Three things to check every time: mark your levels before the session, wait for the close-back-inside plus one more confirming signal, then size and place your stop like the wick is coming back for it...
— dang
Trade Sweeps Faster With Snipethem
Recognizing a sweep is only half the job. Acting on it before the reversal runs its course is what actually separates a good read from a good trade. Snipethem closes that gap by mirroring the entries of top Pump.fun traders in real time, so when a trader you're following reacts to a swept level, your position follows within a fraction of a second.
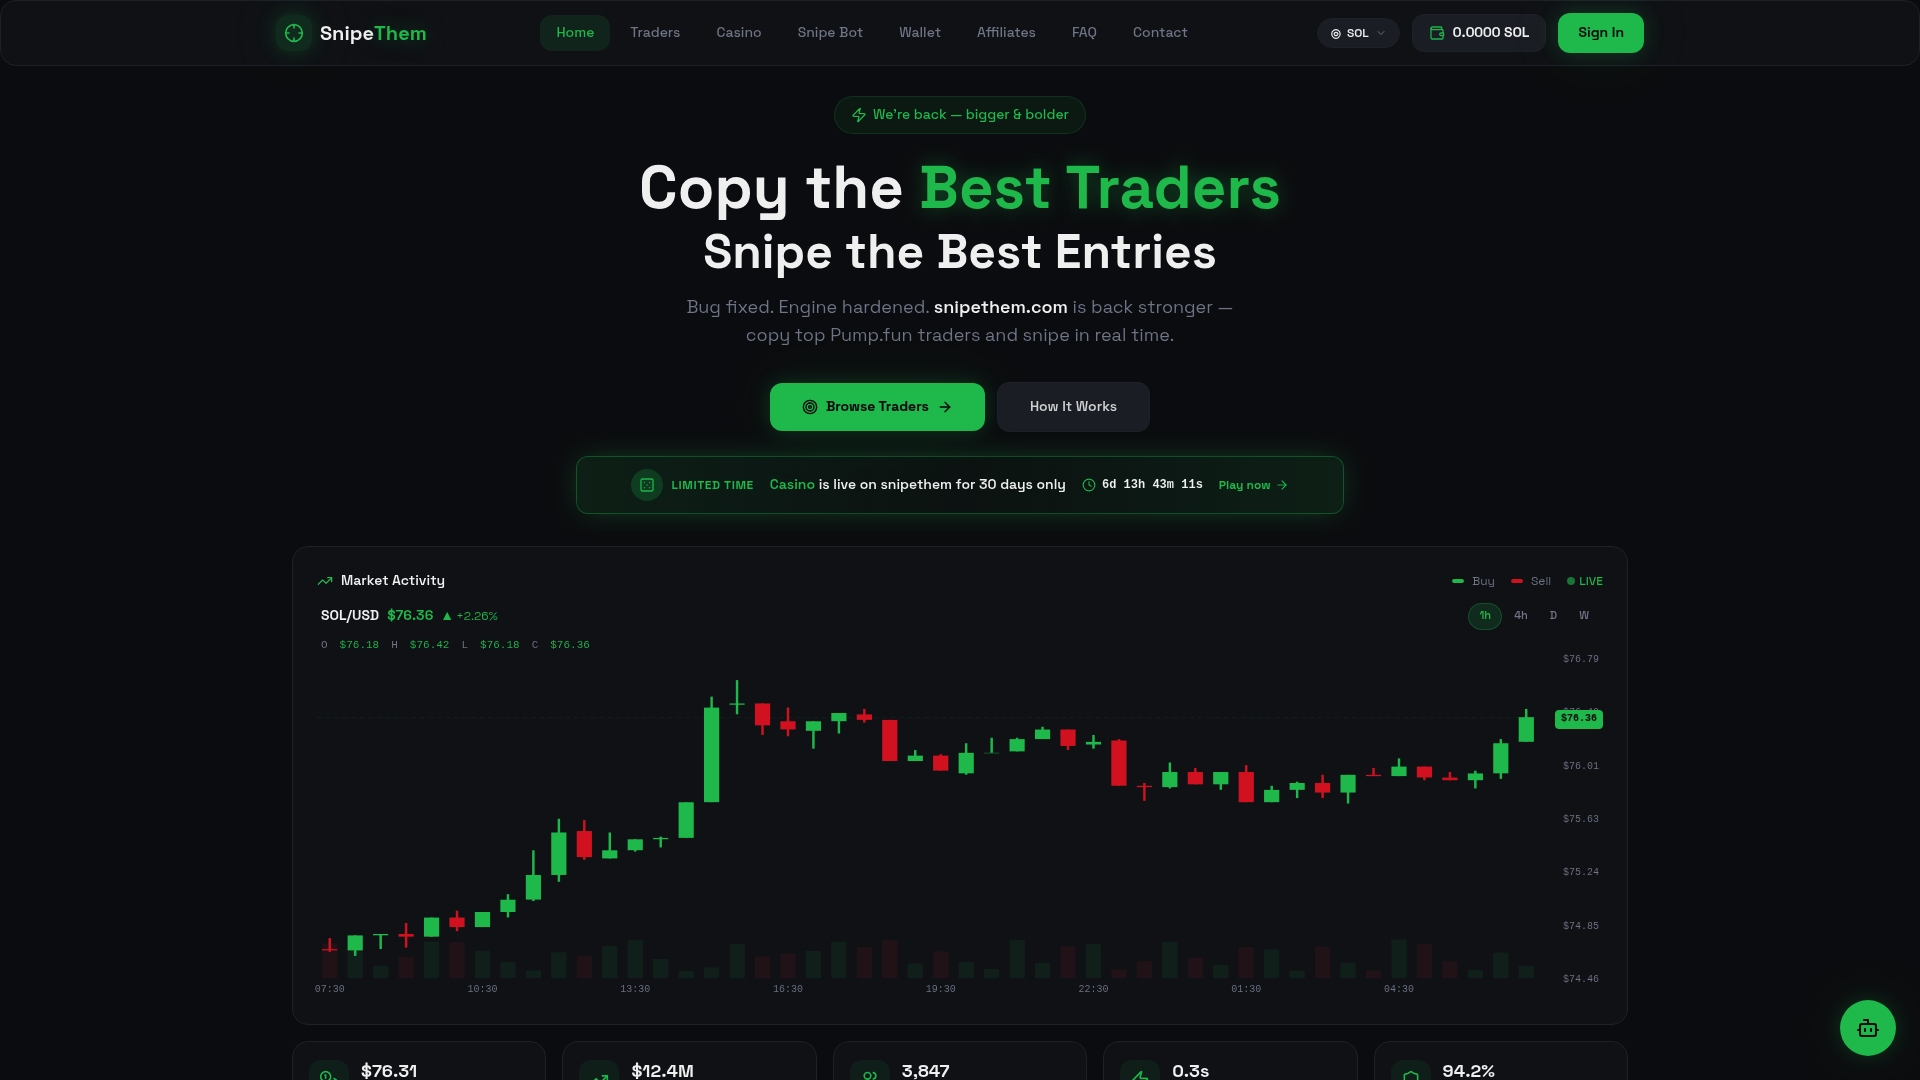
That's the practical edge here: you don't need years of chart experience to react correctly to a sweep, you need a fast, reliable way to copy someone who already does. Snipethem's live analytics and trader rankings let you evaluate execution history before you commit access to any single trader, and the platform's rapid mirroring means you're not manually racing a candle close on your own. Browse the current top Pump.fun traders to copy and see which trading styles line up with the sweep and reversal setups covered here.
For a lower-risk way to build confidence in the mechanics first, backtesting your own read on sweeps with a tool like Trade4 before you size up on mirrored trades is worth the extra step. And if you're weighing whether mirroring fits your risk tolerance at all, what to check before following a trader is a useful gut check before you commit.
Sources
- What Is Stop-Loss Hunting in Crypto? (Market Structure Explained) – Upper Hand Lab
- Liquidity Grab: How Smart Money Hunts Stops Before the Real Move — Oyamori